Measurements of Antenna and North Perimeter Tilting
Visual inspection of tilt using synchronized videos from different viewpoints.
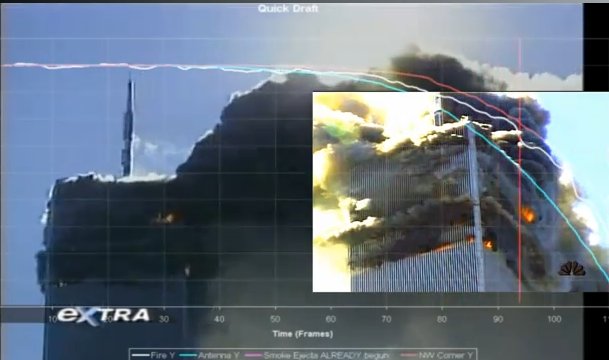
Using synchronized videos and the naked eye we can determine that the
following two images represent the moment when the NW corner has clearly
failed. It is a conservative estimate favoring more tilt, not less:
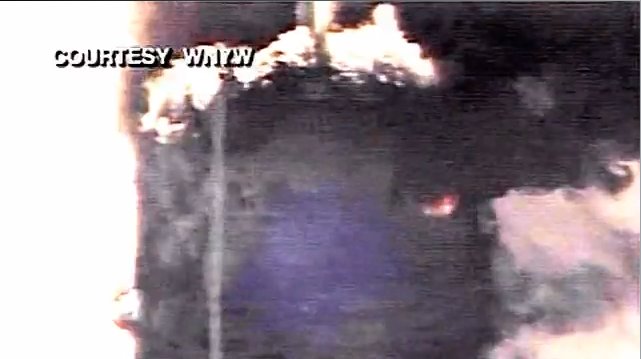
These two images show the true state of tilt just after the moment that
the last columns failed on the NW corner of the building. In the lower
picture the NW corner has already failed at fl 98. The break on the
corner is already visible so this image is a conservative estimate of
true tilt. Precise measurements will actually yield less tilt than is
shown in the images.
If columns on one side of the building are buckling/failing and columns
on the other side of the tower are bending but not buckling, the
building is still in the process of tilting during the failure sequence.
The building tilted to the south and east so the last columns to fail
were along the NW corner.
Notice that the tilt angles are such that the true tilt of vertical
features as all core and perimeter columns failed was within 1 degree.
Measurements which utilize subpixel tracking are necessary at the moment
the NW corner fails to determine the tilt more accurately, but the
images above confirm the angle will be quite small, around 1 degree of
tilt or less.
As seen along the west face, the SW corner and the NW corner fail at about the same time:
The NW corner fail visibly begins to fall downwards at the 0:03 mark. It is already in visible downward motion at this moment:
Actual drop data will reveal even less of a tilt since it can be used to
identify the exact set of frames when failure of the NW corner begins.
Determining the moment of failure of the NW corner using subpixel tracking
The failure of the NW corner can be clearly seen in available videos:
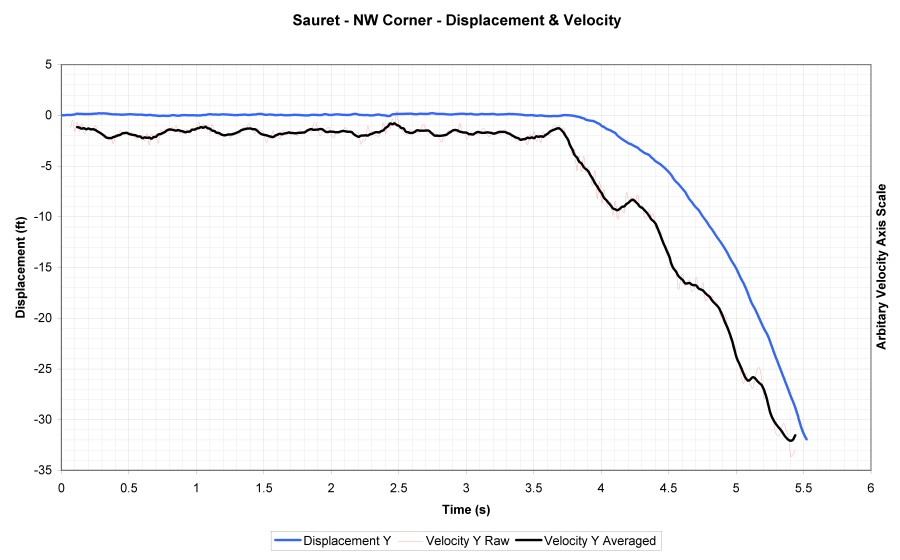
Drop and velocity graphs of the NW corner from the Sauret viewpoint:
The y-axis is marked in feet. The x-axis is time, marked in seconds.
The velocity curve is not scaled along the y-axis. The velocity is
drawn over the drop position curve to compare the shapes of the curves
and the slope transitions in the drop position graph. Please look at
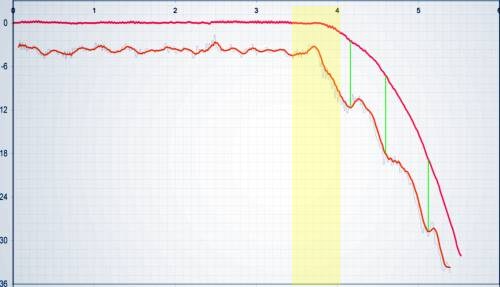
the y axis resolution. The first "speed-bump" (green line) happens
after about 2 ft of falling. The yellow region covers the first 1.5 ft
of falling
If hinged tilt existed evidence for it would be seen in the slope of
the velocity curve in the yellow region. There would be a slow
transition of the slope of the velocity curve over the region of hinged
tilt for the duration of the tilt.
The slope changes from no acceleration to an acceleration between 0.5
and 0.8g very quickly. Hinged rotation cannot be seen as 0.5 to 0.8g
downward acceleration from the Sauret viewpoint in the yellow region.
Velocity slopes consistent with hinged rotation of more than 1 degree do not exist
in the yellow region. The sharp transition of acceleration in the
yellow region and the straightness of the velocity slope over the first 2
ft of falling confirms that the NW corner tilted only slightly before
failing completely.
Also notice that after each speed-bump (each green line), the slope of
the velocity curve returns to about the same value. This slope is the acceleration. The value of that slope returns to the same value after each collision.
Note the tilt when the NW corner fails. By thye time you see an ejection from the NW corner, the corner had already failed:
Subpixel tracking and measurements of tilt angles from north and northeast vIewpoints
Features of the graph:
a) The earliest eastward tilt drift is detectable in frame -100 (or frame 70??)
b) The tilt measures about 0.3 degrees in frame 220
c) By frame 320 the tilt has not yet reached one degree
Features of the east tilting of large antenna :
a) The data of the east tilt shows a gradual drift leaning of the
antenna eastward, beginning more than 4 seconds before the first visible
movement. Downward movement of the antenna begins in frame 155 and
falling begins in frame 215. Notice how drift leaning to the east is
detectable as early as frame -200.
b) The whole antenna is drifting eastward while it leans.
Features of the south tilt graph:
a) A south lean is first detected near frame 175
b) The antenna is leaning about 0.3 degrees to the south in frame 220
(it is later shown that the antenna starts to fall downward at a
significant fraction of g in frame 220
c) The tilt reaches one degree in frame 295
d) By frame 320 the tilt has reached 2 degrees
Features of the angular movement:
a) Between frame 165 and 217 the antenna tilted faster and reached about
0.75°. After frame 217 the tilting of the antenna stopped for the next
40 frames. During that time the antenna just shifted towards south
while the north face (upper floors) apparently tilted more.
In the GIF above the x component of the movement is extremely stretched.
Both axis are numbered each 10000 units. A thin blue line shows the
position 10 frames ahead and a thin yellow line shows the position 10
frames before. The thin horizontal green lines show the measured antenna
section. I extended the vertical lines to see at which elevation the
"antenna" rotates (floor 98 is about at y=70000). It's obvious that the
antenna started to descent at virtually 0° tilting. At about
0.6°tilting the north face gave way and stopped further tilting for the
next 40 frames.)
..................................