It is commonly accepted that the reports written by the National Institute of Standards and Technology (NIST) on the WTC collapses , released in 2005 and 2008, are the single best records of collapse events available to the public.
The reports are examined in part 3 of this book. At the time of their release it was impossible to independently reconstruct events related to the building behaviors and collapses directly from the visual record since much of the material necessary to do so was not available to the public. The necessary information was soley in the possession of the NIST. Also, the computer simulations of building behavior of the twin towers leading up to the collapse events upon which their claims and conclusions are based were never released to the public for independent review.
Only years later were some of the essential components of the complete visual record made available after FOIA requests that the NIST release the information. More detailed imagery of WTC collapse events were released to the public in 2008-2010 as a response to FOIA petitions. This newly released imagery allowed outside independent review of the collapse events directly through the visual record and the ability to directly verify or refute claims made by the NIST and various organizations and individuals for the first time since the 9/11/01 attacks.
RECONSTRUCTIONS OF THE COLLAPSE PROCESSES DIRECTLY FROM THE VISUAL RECORD
The approach this author took toward review and verification of all claims concerning WTC1, WTC2 and WTC7 is quite simple.
First, the largest and most complete visual record possible1 was gathered together and examined directly.
Second, the collapse events from the visual record were reconstructed as completely as possible.
Events reconstructed:
1) Collapse progression: The visual record is re-viewed and reconstructed to determine the collapse mode and global mass flow.
2) Detectable deformation into the collapse initiation sequence: With the visual record and knowledge of the collapse dynamics, the initiation sequences and movement leading up to them are reconstructed and mapped.
3) The aircraft impacts and the resulting fires.
4) The debris layout and condition.
Third, the observations and measurements obtained are used to fact-check claims by all official and non-official sources.
With the first step a library of the visual record of events is formed. As will be demonstrated in parts 2 and 3 of this book, the NIST explanations for both collapse progression and collapse initiation of all 3 collapsed buildings given are verifiably incorrect. Without the formation and analysis of independent visual libraries of the events, the current explanations could never have been examined and cross-checked.
With the second step the first comprehensive visual record and mapping of the collapse progression and collapse initiations of all 3 towers was assembled. The collapse initiation sequences and the events leading up to them are extracted from the visual record using as much visual and measurable evidence as possible. The aircraft impacts are also reconstructed as completely as possible to check the impact angle and building features during impact. The resulting debris layout is also recorded and grouped according to region.
The third step uses the reconstructed events and mapping of the rubble condition and distribution to independently verify or refute various claims made about the collapses. Many of the resulting observations do not appear in any official or academic reports or papers on the collapses. Some of the observations and measurements directly contradict the official descriptions of the collapses.
This approach to constructing sets of sequenced mappings from observed events is very similar to what the NIST claims to have done within their reports. The stated purposes of the NIST reports and their reliance on the visual record for inputs to their model are discussed in detail in sections 3.1 and 3.5 of this book.
The NIST used observations to develop timelines just as this book uses features to develop mappings. As they describe in NCSTAR 1-6 section 9.2:
Observables were used in all the analyses in three ways: (1) to determine input parameters, such as the aircraft speed and direction at impact, (2) to impose time-related constraints on the analysis, such as imposing observed broken windows over time to constrain the spread of fire, or (3) to validate analysis results, such as global stability after impact and during thermal loading.
HOW DOES ONE TRACK THE MOVEMENT OF A COMPLEX DEFORMING OBJECT?
It is probably best to track and list as many attributes of the moving object as possible. The complex motion can then be deciphered by considering all the measurements and observations listed to be true in the same time interval, as elements of the complex behavior are all happening together over a very short time interval. For example, if measurements A, B and C and observations C, D, and F are made over a 3 second interval, then the complex motion can be understood as the statement:
A, B, C, D, E, F are simultaneously true (over the 3 second interval).
Complex motion requires a complex description involving many near simultaneous features and measurements. To try to grasp it, the observer must keep all the relevant events and measurements in mind over a specific time interval. One cannot pick and choose which measurements and observations exist. They must all be taken together and understood as a whole.
Likewise, one cannot assume any particular global geometry. For example, simply because the WTC1 north wall is observed to fall outside the lower portion does not mean that the south wall fell inward. Considering deformation and small tilt angle during the failure sequence, both south and north walls can fall outside the lower portion. Each perimeter wall failure has to be mapped individually, since the behavior of one wall does not determine the behavior of an adjacent or opposite wall.
It is natural to list all key indicators of structural failure such as:
1) Structural deformations 2) Ejections and overpressures indicating internal activity 3) Movement through the initial column failure sequence
including
4) The earliest detectable movement, which can be found by tracing the collapse initiation movement of various points on the building back to the moment in time when it first becomes detectable.
It will be clearly shown that the building moved in a quite organized way as 3 main structural elements within this section and the next: (1) flooring, (2) core, and (3) perimeter. For this reason it is also natural to ask how each exterior wall moved and how the core moved.
How did floors move?
Did the upper portion of the exterior wall fall within the lower portion or did it fall out and over the lower portion?
Along what failure line did it give?
Where were the earliest deformations detectable?
How does that relate to the earliest detectable motion?
How can the transition between earliest deformations and the earliest detectable motion be explained structurally?
A person cannot choose which features to "allow to exist" and which features to randomly ignore. If one reviews the NIST description of collapse initiation (in section 3) and the Bazant description of the collapse progression (in section 3.6), it is clear that observations and measurables seem to be chosen almost at random. Most every major observable is basically ignored, while both parties seemed to see only what they chose to see.
It will be demonstrated that the NIST substituted false data and observables for a realistic descriptions of building behavior while Bazant ignored observables as large as global perimeter movement. When Bazant claimed that his crush down, then crush up model matches all observables, he was clearly picking and choosing which observables to consider and which to ignore.
THE FINE LINE BETWEEN VERIFICATION AND SPECULATION
It is important to verify what one can. It makes no sense to spend time speculating over something that is within ones power to verify. In fact, one would think it is the duty of a researcher or journalist to verify what one can, and to understand the difference between verification and speculation.
Earlier research into the collapse events prematurely concluded that the collapse processes could not be visually mapped. Much of the attacks and collapses could be reconstructed from the raw visual record of the events if people made the effort to do it carefully.
It wasn't a case that it couldn't be done, but that so few people did it.
One can go back to exchanges during 2007-2008 across multiple media to verify that there were no mappings of the collapses at all. That means 6 to 7 years after the collapses, and 2 to 3 years after the NIST reports were released on WTC1 and 2, there was still no concrete understanding that massive chains of progressive floor collapses were the most probable collapse propagation mechanisms for those buildings.
THE VALUE OF MAPPING ACCURATELY
Physics, astronomy, chemistry, biology, geology, anatomy are some of the most fundamental 'external' mappings ever created by human beings.
Researchers at the frontiers of any science can be thought of as "map makers". They are doing nothing more than mapping structure, quantitative and qualitative features and mechanisms. They are mapping form and pattern. The applied part of science and engineering is in the manipulation of the structures and mechanisms inherent in nature for specific uses.
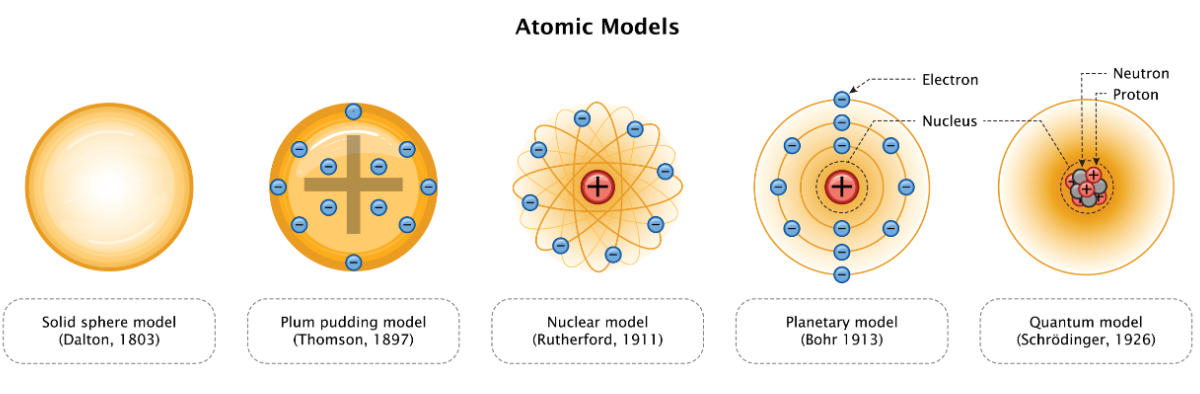
Mapping fundamental constituents of matter by smashing them together and watching what comes out:
On the value of clarity and detail in a map
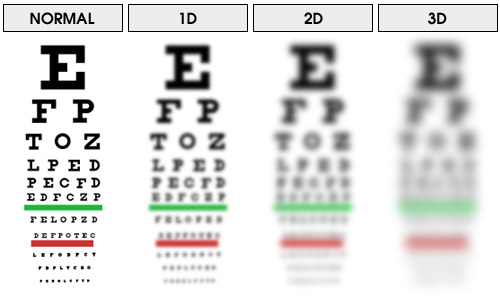
The clarity of ones map allows one to move from the vague to the specific.
Mappings of the atom,
The parallel between the clarity or vagueness in ones mappings and seeing a blurry image through a dirty or out of focus lens is striking.
A good mapping is like seeing through clean glasses with lenses in focus. To the degree ones conception or mapping is vague and indistinct, one cannot clearly see what is going on. Cartoons, abstractions and misrepresentations are foggy conceptions.
As mentioned earlier, the scientific method is completely dependent on accurate and detailed observations and measurements. An accurate collapse record must be based within the most comprehensive and accurate list of observations and measurements on the collapses possible. These mappings cannot be simplified and must be understood in detail. Richard Feynman explains4:
Likewise, the author does not simplify building movements or fake them. The author does not tell you the buildings behave something like blocks or like ball bearings on a spring, because they don't. They do not behave as Dr Bazant claims, nor do they tilt rigidly as the NIST claims.
The author is simply describing how the buildings actually behaved using the most accurate mappings possible.